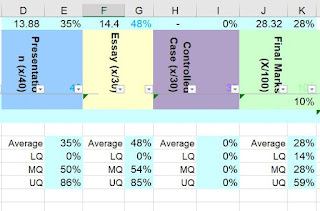
When we are working in Excel these are exceptionally easy to set up. The formula for the quartiles is:
=QUARTILE(array, quartile value)The quartile function includes an array, which is the range of the cells that you want the quartile to return a value for; and which particular quartile you want to measure (ie, minimum value, first quartile, median, third, or maximum).
Each one of these has a number which goes into the formula.
0 = Minimum value
1 = First quartile (25th percentile)
2 = Median value (50th percentile)
3 = Third quartile (75th percentile)
4 = Maximum value
So my median quartile might look like this:
=QUARTILE(A3:A75,2)It is very easy when you know how!
Sam
- Reference: Support.Office (2020). QUARTILE function. https://support.office.com/en-us/article/quartile-function-93cf8f62-60cd-4fdb-8a92-8451041e1a2a


No comments :
Post a Comment
Thanks for your feedback. The elves will post it shortly.