Pages

Showing posts with label analysis. Show all posts

Monday, 27 February 2023

Excel formulas from concatenated data

If, like me, you have been trying for ages to create formulas from concatenated data in Excel, then this is the post for you! For those of you who are already glazing over, perhaps skip this post :-)

I use spreadsheets a lot for descriptive analysis of survey data, managing student information, and for marking. It is with marking in mind that I wanted to use a concatenate function for creating a summary page in an Excel workbook. 

I have a tab (sheet) for each student, named with the student name so it auto-fills the student name field (see here for how to do that). That name is repeated on a summary page which is a VLookup so I don't have to fill in the student ID number (and here for how to do that). On that page I wanted to also show a copy of the mark for each student so I could see them all in one place, at a glance.

Concatenate seemed the logical function to compile the formula, but I could never get it to activate. I tried Shift and Enter, but that didn't work. I postponed following up on it. I would periodically search, but my search terms were obviously not accurate enough.

But then, late last year, I found a solution, thanks to tbhesswebber (2013), who posted that "a dynamic formula" was needed for "a template that we copy each month, so when I change the name of the month and I change the year, it will refer to a different folder and/or a different month within the folder". I wanted the formula to refer to a different name for each new marking sheet that I created. Same process, different object.

The solution from tbhesswebber got quite complicated, but my takeaway was that I needed to use "=INDIRECT()" with my concatenate formula nested inside (2013). The concatenate function was: (a) the open quote mark to signify that this was a named tab in the workbook, "'"; (b) the student name of the tab in "Student's Full Name", B2; (d) the close quote mark to close the named tab, "'"; (d) and the sum cell in each tab, or F$1. Then all I needed to do was to enclose this in the INDIRECT element. My formula was:

=INDIRECT(CONCATENATE("'",B2,"'",F$1))

Thank you very much, tbhesswebber!


Sam

Reference:

tbhesswebber. (3 February 2013). Answer to Can I create a formula using concatenate?. https://www.excelforum.com/excel-formulas-and-functions/592520-can-i-create-a-formula-using-concatenate.html

read more "Excel formulas from concatenated data"

Friday, 5 August 2022

TextJoin function in Excel

Where we have simple requirements, Excel can be very useful for analysing, grouping and clustering survey data. However, to get the most out of the simple analysis which Excel does, being aware of some of the on board tools can certainly make a straight-forward job even more powerful.

For example, there are several ways to concatenate elements within a range. We can use a formula such as concatenate, or we can use the more streamlined version, TextJoin.

TextJoin allows us to collapse materials and show a spread of answers in one cell. It allows the formula to ignore any blanks in the formula and only concatenate those items which contain more than zero. This can be particularly useful if we are compiling a range of answers into one field. The image accompanying this post shows how all the fields are pulled into one, including specifying a delimiter: in this case, a space, and a comma.

A deliminator could be a hyphen, a line of text, or simply a space.

The structure of putting together a TextJoin function is as follows, with the formula first, and the example following:

=TEXTJOIN(delimiter, TRUE, Cell_range)

=TEXTJOIN(", ",TRUE,B3:B8)

This is a very useful formula.

Sam

References:

CFI. (2019). TEXTJOIN Function. https://corporatefinanceinstitute.com/resources/excel/functions/textjoin-function/

ExtendOffice. (2014). Concatenate Cells But Ignore Blanks. https://corporatefinanceinstitute.com/resources/excel/functions/textjoin-function/

read more "TextJoin function in Excel"

Wednesday, 25 May 2022

Some thematic analysis resources

Many great resources can be found for qualitative research, but one tool I particularly like is thematic analysis. Two researchers, Braun and Clark, have done some fabulous work in this area (2006, 2013, 2014, 2017, 2018, 2019), clarifying over time that there are a few fields within the practice of thematic analysis. They include reflexive thematic analysis, which is the area that Braun and Clarke have codified (2019, 2021).

Braun and Clarke's six step approach to thematic analysis has proved very helpful for my research students in the past, and continues to add value today. In their latest publication, Braun and Clarke (2021a, 2021b) have provided some excellent resources via the SAGE Publications Ltd website (2022a, 2022b), as follows:

  • Preview Chapter one of the book using the Google Preview viewer here (SAGE Publications Ltd, 2022b). Unfortunately there is no download pdf of the chapter, which I think is a pity. However, the chapter is an interesting read.
  • Check out the student resources here (SAGE Publications Ltd, 2022b). There is a wealth of materials to be found, including teaching resources. There are videos, slide decks, and worksheets. Although the slide decks are very wordy, they do provide an 'importance' outline: helpful when considering what we might like to emphasise. I found the slide deck on teaching transcripts interesting, even though I do prefer Johnny Saldaña's approach to transcripts (2016). There is always something to learn!
  • Virginia Braun (Ginny) has a YouTube channel here, while Victoria Clarke's channel is here.
  • Creative Commons resources supporting Thematic Analysis is hosted by the University of Auckland, here.
  • And a free, downloadable pdf chapter on teaching thematic analysis is available here.

Finally, if you possess an Amazon account, a free Kindle chapter can be downloaded in .azw format from here.


Sam

References:

Braun, V. (2022). Virginia Braun [channel]. https://www.youtube.com/channel/UC9ud2Ifr3qpZucM1PX9AqCw/videos

Braun, V., & Clarke, V. (2006). Using thematic analysis in psychology. Qualitative Research in Psychology, 3(2), 77–101. https://doi.org/10.1191/1478088706qp063oa

Braun, V., & Clarke, V. (2014). What can “thematic analysis” offer health and wellbeing researchers?. International Journal of Qualitative Studies on Health and Well-being, 9(1), 26152, 1-2. https://doi.org/10.3402/qhw.v9.26152

Braun, V., & Clarke, V. (2019). Reflecting on reflexive thematic analysis. Qualitative Research in Sport, Exercise and Health, 11(4), 589-597. https://doi.org/10.1080/2159676X.2019.1628806

Braun, V., & Clarke, V. (2021a). Thematic Analysis: A Practical Guide. SAGE Publications Ltd.

Braun, V., & Clarke, V. (2021b). Teaching, supervising, assessing and examining thematic analysis in Thematic Analysis: A Practical Guide. SAGE Publications Ltd. https://study.sagepub.com/sites/default/files/additional_chapter_-_teaching_supervising_assessing_and_examining_ta.pdf

Braun, V., Clarke, V., Hayfield, N., & Terry, G. (2019). Chapter 48: Thematic analysis. In P. Liamputtong (Ed.) Handbook of Research Methods in Health Social Sciences (pp. 843-860). Springer Nature. https://doi.org/10.1007/978-981-10-5251-4_103

Clarke, V. (2022). Victoria Clarke [channel]. YouTube. https://www.youtube.com/channel/UCLBw6Qig8KBId9YuIMzAg7w/videos

Clarke, V., & Braun, V. (2013). Successful qualitative research: A practical guide for beginners. SAGE Publications Ltd.

Clarke, V., & Braun, V. (2017). Thematic analysis. The Journal of Positive Psychology, 12(3), 297-298. http://dx.doi.org/10.1080/17439760.2016.1262613

Clarke, V., & Braun, V. (2018). Using thematic analysis in counselling and psychotherapy research: A critical reflection. Counselling and Psychotherapy Research, 18(2), 107-110. https://doi.org/10.1002/capr.12165

SAGE Publications Ltd. (2022a). Student Resources. https://study.sagepub.com/thematicanalysis/student-resources

SAGE Publications Ltd. (2022b). Thematic Analysis, Chapter 1 preview. https://au.sagepub.com/en-gb/oce/thematic-analysis/book248481#preview

Saldaña, J. (2016). The Coding Manual for Qualitative Researchers (3rd ed.). SAGE Publications Ltd.

Thematic Analysis. (2022). Home. https://www.thematicanalysis.net/

read more "Some thematic analysis resources"

Wednesday, 16 June 2021

Formatting times in Excel

I tend to suggest that my students use MS Excel to analyse their qualitative data transcripts. While Excel is not perfect, it has the advantage of being cheap, relatively easy to use, and a well-known and transportable format.

There are some tricky elements to working with Excel. One is that times entered into Excel have a nasty habit of turning from minutes counted (such as the duration of an interview) to clock time. If you are trying to total interview minutes, and the data keeps changing format, all totals have to be checked very, very carefully. In addition, since moving to Office 365, I have had problems with Excel's custom number formatting disappearing after updates.

As a result, it is worth detailing how to format time in Excel to get total minutes, as opposed to clock time. The instructions are

  • On the home ribbon in Excel, click the expansion arrow under the numbers section:

  • The dialogue box which appears will show number formats, and be selected on the General number type:


  • Change the number format to “Custom”, at the bottom of the list:


  • Under the Type heading, General is the default number format. Highlight this, as we are going to replace it:


  • Key the following format code into the Type box (thanks to Bigoceans, 2012):
    [h]:mm;@

  • Click OK.

Time should now add as interview time; in hours, minutes and seconds – no longer as clock time.


Sam

read more "Formatting times in Excel"

Wednesday, 28 October 2020

Stages of data analysis

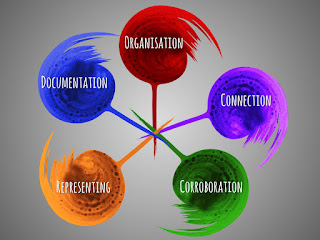
In a previous post (here), I discussed four steps of Schutt's data analysis model. However, in his text, Schutt outlines five steps.

I thought I would expand on all five of these steps in this post. They are (Schutt, 2011, p. 325):
  1. "Documentation of the data and the process of data collection": this is where we have gathered all our field notes together. We have reflected, we have organised our field notes; we have digitised everything. We have a research diary which we have noted our impressions in, and we have digitised this as well. We may start to see concepts, and should be making notes as we document - "margin notes', effectively - that may form the basis of our coding. We start preliminary categorisation of responses.
  2. "Organization/categorization of the data into concepts": this is where we have started to see connections between our various groups of data. We can see the tenuous connections, ideas are beginning to form. We may need to discuss our ideas with others, to read more widely, to look for whether this has happened elsewhere to "resolve points of confusion". We need to interact with our data repeatedly, over time. Schutt suggests using a checklist matrix to interrogate our data.
  3. "Connection of the data to show how one concept may influence another". We look for connections; we look for hierarchy; we look for 'upstream' and 'downstream'; we look for difference; and we look for sameness. We start to see the outlines of influence, of relationships, of connectedness. An example which Schutt uses is from Becker (1958):

    "When we first heard medical students apply the term 'crock' to patients, we made an effort to learn precisely what they meant by it. We found, through interviewing students about cases both they and the observer had seen, that the term referred in a derogatory way to patients with many subjective symptoms but no discernible physical pathology. Subsequent observations indicated that this usage was a regular feature of student behavior and thus that we should attempt to incorporate this fact into our model of student-patient behavior. The derogatory character of the term suggested in particular that we investigate the reasons students disliked these patients. We found that this dislike was related to what we discovered to be the students’ perspective on medical school: the view that they were in school to get experience in recognizing and treating those common diseases most likely to be encountered in general practice. 'Crocks,' presumably having no disease, could furnish no such experience" (Schutt, 2011, p. 328)

  4. "Corroboration/legitimization, by evaluating alternative explanations, disconfirming evidence, and searching for negative cases". We start to see what is really there, instead of what we expect to see. This is the hardest part for all of us. We can often be blind to what we are seeing. We need to be sure that what we are seeing is authentic.
  5. "Representing the account (reporting the findings)". Writing. Rewriting. Polishing. Seeking clarity in the account.
These five steps are taken from Chapter 10 of Schutt's book, which I find is superb. If your library has a copy, get it out, and read it :-)


Sam
  • Reference: Schutt, R. K. (2012). Investigating the Social World: The Process and Practice of Research (7th ed.). Pine Forge Press.
read more "Stages of data analysis"

Friday, 17 July 2020

Data wholes and holes

A kaleidoscope metaphor describing one approach to
analyzing qualitative data (Suter, 2011, p. 349)
I have recently had an undergraduate student who had absolutely no idea where to start with qualitative data analysis. The student had planned the entire project, had successfully collected the primary data, but then was completely, utterly lost with what to do next with the recordings. They had no cultural context or feel for the data that had been collected.

While I was able to provide more and chapters on analysing findings for the student to read, I quickly realised that what I was providing was still not giving them a framework to work within. It was a really interesting problem: like the old adage, I was attempting to explain colour to the blind. I struggled to find a structure which would show the student some steps to help them gain the confidence to begin the process of analysis.

The student had no access to any specialist software, but did have access to Office 365. They had adequate Word skills and some Excel skills. They had recorded their interviews on their phone. My solution had to be relatively low-tech.

I did some thinking. I did not want to be overly prescriptive, but when you have a student who doesn't even know where to start, the desire not to be prescriptive becomes a problem in itself. What follows is the first draft of what I came up with for this particular student.

1. Preparation:
  • We gather our data (interviews, or focus groups) by recording it as video or sound files. We listen to it a number of times so we get familiar with the data (making a playlist and listening to it on an iPod or phone helps).
  • Transcribe the into Word with timestamps separated by a tab from the script (transcribe the script as one sentence, or paragraph until there is a pause or change of speaker, then start with the next timestamp and paragraph).
  • Once the transcript is complete, copy the tabbed transcript into Excel. Excel will import the first column as timestamps, and the second column will be the script for that sentence, or set of sentences until there is a pause or change of speaker. We insert a new second column and add the speaker's name against each timestamp.
  • We add our field notes into the fourth column against the appropriate time stamp.
  • If we have any rough ideas of themes, we can note those a fifth column at the appropriate time stamp.
Now we can start analysing what data we have.


2. Analysis (first run):
We need to start looking for "wholes and holes" to quote Suter (2011, pp. 348-349) and see the image accompanying this post (this kaleidoscope metaphor comes from the 2000 work of Dye, Schatz, Rosenberg and Coleman and is very helpful in allowing us to shift the data a little, and see what the new 'frame' looks like). We could use a similar metaphor such as working with Lego. First we look through all sort through all our pieces or partial constructions and start to group all the similar pieces or elements together. We look for patterns. We deconstruct some pieces and reconfigure them, trying to understand how and why they were built in that particular way. We put them back together. We reorganise them.
Suter also suggests that we consider "a jigsaw puzzle (LeCompte, 2000). Assembling data into an explanation is akin to reassembling puzzle pieces. One strategy is grouping all pieces that look alike, sky for example, and placing these pieces near the top. Other sketchy-looking objects may be grouped together using any dimension (e.g., color) whose properties make conceptual sense. Puzzle pieces will have to be rearranged many times before the reassembled pieces emerge into a coherent pattern" (2011, p. 348).
  • We have our data in Excel. We now think about what impressions we have of our data now. We can re-read our transcript and think that "communication" seems to come up a lot, so we could head up a column 6 with "Communication" and add a '1' in this column whenever the issue of communication appears. We have an initial code for communication. Add new row at the top of the sheet, and sum the column to see how many times communication appears.
  • Look for more patterns and repeating ideas. Add new columns. Keep adding in a number whenever the code appears in the data.
  • Rinse repeat.
  • Complete coding our first interview/focus group.
  • Add a workbook tab, and using the same Excel framework as for interviewee/focus group one, do the same for interviewee two's transcription. Add more codes where they appear. Go back and see if this code appears in interviewee/focus group one's data.
  • Rinse repeat until all interviewee//focus groups are complete.
Our first cut of the data and our initial coding is complete.

3. Analysis (second run +):
We can consider Suter's review of "Seidel (1998): Qualitative data analysis is best understand as a symphony based on three elegant but simple notes—noticing, collecting, and thinking. Clearly not linear, the process is described as iterative (a repeating cycle), recursive (returning to a previous point), and 'holographic' (each 'note' contains a whole) with 'swirls and eddies.' When one notices, one records information and codes it using an organizing framework. When one collects, one shifts and sorts information." (2011, p. 348) and "When one thinks, one finds patterns, makes sense of them, and makes discoveries" (p. 349).
  • We now need to review our first run. We will need to re-read and review our data several times, to see whether we understand what is really happening. We need to consider whether our initial codes are the 'real' codes, or whether there is something else going on. Are there ways we can group elements together: so where we saw communication as being a code, is that actually a symptom of feeling connected? Or is it part of the culture? Or should it be broken up into body language, tone, inflection and silence? Or is about power and lack of power?
  • As we start to get more familiar with what we are looking at, we will see more layers. Where these additional layers turn up, do a save as on our 'raw' Excel workbook, and start playing with new codes and counts.
  • We need to make a lot of notes, and dig back into our literature to codify our thoughts, ideas, and questions. Add more columns. Do more counts.
  • We are looking for themes within the data. These might be language, opinions, beliefs, ideas, motivations, clusters, or codes which turn up in a particular order (CampusLabs, n.d.).
  • We cross-tab our data. We compare between questions, between interviewees, between field notes and interview data. Because we are in Excel we can pull graphs, percentages, cluster, tabulate and project.

    4. Write up the patterns:
    Now we can start writing our findings chapter. We need to think about who our reader will be, what we set out to discover, and how we can best tell our story, but we now have somewhere to start our process (CampusLabs, n.d.).

    I hope this helps. It is one way, anyway :-)


    Sam

    References:
    read more "Data wholes and holes"

    Monday, 18 March 2019

    SurveyMonkey word cloud

    This year, SurveyMonkey introduced a word cloud feature that helps researchers to see any similarity in the text responses to open-ended survey questions.

    What is more, it is easy to use. Simply go to a text question you want to analyse this way, then click on the tab immediately after the "Responses (xxx)" tab that says "Word cloud". You can adjust colour, frequency etc, then export the resulting cloud as a .png file, save it on your survey dashboard, or both.

    We need at least five survey results to be able to generate a word cloud. SurveyMonkey's word cloud algorithm automatically excludes a number of words which are unlikely to be useful in our results:
    a, about, above, after, again, against, all, am, an, and, any, are, aren't, as, at, be, because, been, before, being, below, between, both, but, by, can, can't, cannot, com, could, couldn't, did, didn't, do, does, doesn't, doing, don't, down, during, each, else, ever, few, for, from, further, get, had, hadn't, has, hasn't, have, haven't, having, he, he'd, he'll, he's, her, here, here's, hers, herself, him, himself, his, how, how's, http, I, I'd, I'll, I'm, I've, if, in, into, is, isn't, it, it's, its, itself, just, k, let's, like, me, more, most, mustn't, my, myself, no, nor, not, of, off, on, once, only, or, other, ought, our, ours, ourselves, out, over, own, r, same, shall, shan't, she, she'd, she'll, she's, should, shouldn't, so, some, such, than, that, that's, the, their, theirs, them, themselves, then, there, there's, these, they, they'd, they'll, they're, they've, this, those, through, to, too, under, until, up, very, was, wasn't, we, we'd, we'll, we're, we've, were, weren't, what, what's, when, when's, where, where's, which, while, who, who's, whom, why, why's, with, won't, would, wouldn't, www, you, you'd, you'll, you're, you've, your, yours, yourself, yourselves.
    Once we have created the word cloud, we simply save it, choose the format, then we can download it. While I am sure at higher levels the functionality will be much more whizzy-do, it is not bad at the bottom end either :-D


    Sam
    read more "SurveyMonkey word cloud"